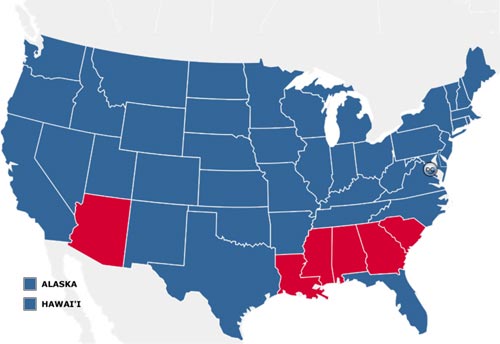
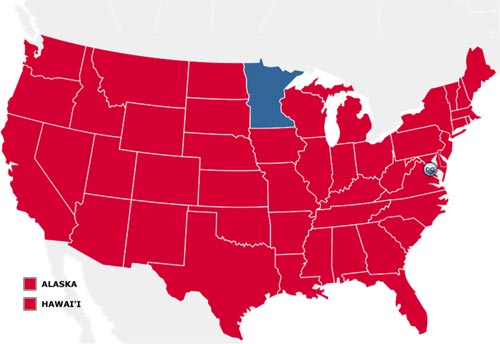
×
2024 Election Projection Interactive Electoral Map Joe Biden Quotes Voting Trends by State Candidate Favorability Index Inflation Calculator 2024

Presidential Voting History of Arizona (Since 1960)


The Electoral Voting history of the great state of Arizona


One-time Red State bastion now trends as a Swing State / Battleground State in Presidential Election cycles. Republicans dominated from 1960 to 1992 and from 2000 to 2016, losing only in 1996 and recently in 2020. The state has seen a population boom due to the mass exodus of residents from California which have driven both Republican and Democrat voter numbers in Arizona up by considerable margins (Democrats closing the gap in this regard). As such, Arizona Electoral Power is set to grow in the coming election cycles. Republicans take the state about 52% of the time and in 14 of the election cycles since 1960 but the state Picks the Winner only 56% of the time.

All data is from 1960 to the present day (covering what we term to be the 'Modern Voter') and focuses solely on the Democratic and Republican party results during that span.
Trending
Battleground
State
Picking the Winner*
56.3%
(Correct in 9 of 16 elections since 1960)
Electoral Power
ASCENDING
(Influenced by U.S. Census data)

Democrat Victories
2
(12.5%)
(D) Average Result
47.9%
(Last Three Elections)
(D) Strength Trending**
UP
(Last Three Elections)
(D) Votes Net Gain
212,479
(Avg Last 3 Elections)
Republican Victories
14
(87.5%)
(R) Average Result
52.1%
(Last Three Elections)
(R) Strength Trending**
UP
(Last Three Elections)
(R) Votes Net Gain
143,858
(Avg Last 3 Elections)

3rd Pty Victories
0
(0.0%)
2020 Result
Democrat
(49.4%)
(2024 Projection)
Republican
(50.7%)


* The states with the highest success rates selecting U.S. President are Ohio and Nevada, the pair having picked the winning candidate in 14 of the last 16 (87.5%) national elections since 1960. Those states / districts (such as Washington, D.C.) voting strictly along party lines will generally have a poorer success rate.
** Strength Trending is not a measure of total number votes available to any one party in a given state but rather overarching trending patterns observed within the last three presidential election cycles.


Average Votes
1,286,181
1,382,580
Dem +/- 354,831 :: Rep +/- 308,475
1960
1964
1968
1972
1976
1980
1984
1988
1992
1996
2000
2004
2008
2012
2016
2020
1960 - Arizona
D: 176,781
R: 221,241
Kennedy (D) vs Nixon (R)
1960 Pop: 1,321,000
D+R Votes: 398,022 (30.1% of Pop)
Margin of Victory: +44,460
D: 44.4% | R: 55.6%
EC Votes (ECVs): 4
1.5% of 269 ECVs needed to win.
0.7% of 537 overall available ECVs.
1960 Electoral Coverage 1960 Electoral Map
1964 - Arizona
(D) +60,972 | (R) +21,294
D: 237,753
R: 242,535
Johnson (D) vs Goldwater (R)
1964 Pop: 1,556,000 (Diff: 235,000)
D+R Votes: 480,288 (30.9% of Pop)
Margin of Victory: +4,782
D: 49.5% | R: 50.5%
EC Votes (ECVs): 5
1.9% of 270 ECVs needed to win.
0.9% of 538 overall available ECVs.
1964 Electoral Coverage 1964 Electoral Map
1968 - Arizona
(D) -67,239 | (R) +24,186
D: 170,514
R: 266,721
Humphrey (D) vs Nixon (R)
1968 Pop: 1,682,000 (Diff: 126,000)
D+R Votes: 437,235 (26.0% of Pop)
Margin of Victory: +96,207
D: 39.0% | R: 61.0%
EC Votes (ECVs): 5
1.9% of 270 ECVs needed to win.
0.9% of 538 overall available ECVs.
1968 Electoral Coverage 1968 Electoral Map
1972 - Arizona
(D) +28,026 | (R) +136,091
D: 198,540
R: 402,812
McGovern (D) vs Nixon (R)
1972 Pop: 2,008,000 (Diff: 326,000)
D+R Votes: 601,352 (29.9% of Pop)
Margin of Victory: +204,272
D: 33.0% | R: 67.0%
EC Votes (ECVs): 6
2.2% of 270 ECVs needed to win.
1.1% of 538 overall available ECVs.
1972 Electoral Coverage 1972 Electoral Map
1976 - Arizona
(D) +97,062 | (R) +15,830
D: 295,602
R: 418,642
Carter (D) vs Ford (R)
1976 Pop: 2,346,000 (Diff: 338,000)
D+R Votes: 714,244 (30.4% of Pop)
Margin of Victory: +123,040
D: 41.4% | R: 58.6%
EC Votes (ECVs): 6
2.2% of 270 ECVs needed to win.
1.1% of 538 overall available ECVs.
1976 Electoral Coverage 1976 Electoral Map
1980 - Arizona
(D) -48,759 | (R) +111,046
D: 246,843
R: 529,688
Carter (D) vs Reagan (R)
1980 Pop: 2,810,000 (Diff: 464,000)
D+R Votes: 776,531 (27.6% of Pop)
Margin of Victory: +282,845
D: 31.8% | R: 68.2%
EC Votes (ECVs): 6
2.2% of 270 ECVs needed to win.
1.1% of 538 overall available ECVs.
1980 Electoral Coverage 1980 Electoral Map


1984 - Arizona
(D) +87,011 | (R) +151,728
D: 333,854
R: 681,416
Mondale (D) vs Reagan (R)
1984 Pop: 3,184,000 (Diff: 374,000)
D+R Votes: 1,015,270 (31.9% of Pop)
Margin of Victory: +347,562
D: 32.9% | R: 67.1%
EC Votes (ECVs): 7
2.6% of 270 ECVs needed to win.
1.3% of 538 overall available ECVs.
1984 Electoral Coverage 1984 Electoral Map
1988 - Arizona
(D) +120,175 | (R) +21,125
D: 454,029
R: 702,541
Dukakis (D) vs H.W.Bush (R)
1988 Pop: 3,622,000 (Diff: 438,000)
D+R Votes: 1,156,570 (31.9% of Pop)
Margin of Victory: +248,512
D: 39.3% | R: 60.7%
EC Votes (ECVs): 7
2.6% of 270 ECVs needed to win.
1.3% of 538 overall available ECVs.
1988 Electoral Coverage 1988 Electoral Map
1992 - Arizona
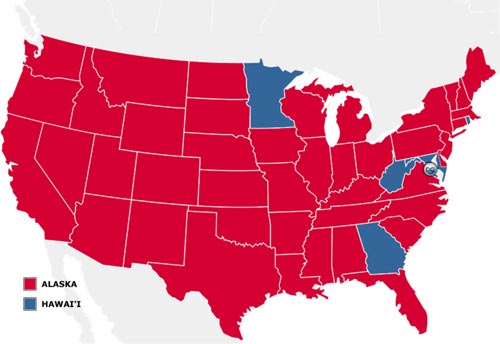
(D) +89,021 | (R) -130,455
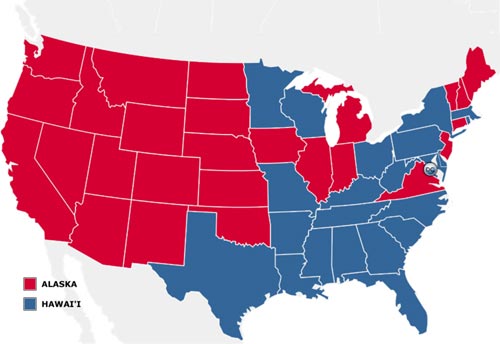
D: 543,050
R: 572,086
B.Clinton (D) vs H.W.Bush (R)
1992 Pop: 3,867,000 (Diff: 245,000)
D+R Votes: 1,115,136 (28.8% of Pop)
Margin of Victory: +29,036
D: 48.7% | R: 51.3%
EC Votes (ECVs): 8
3.0% of 270 ECVs needed to win.
1.5% of 538 overall available ECVs.
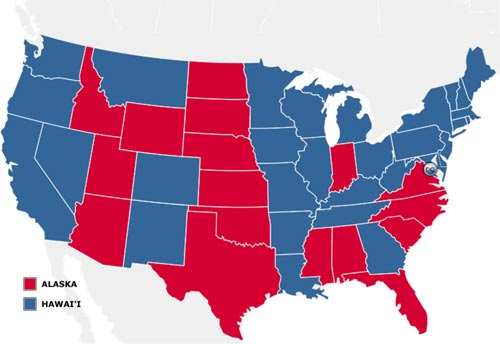
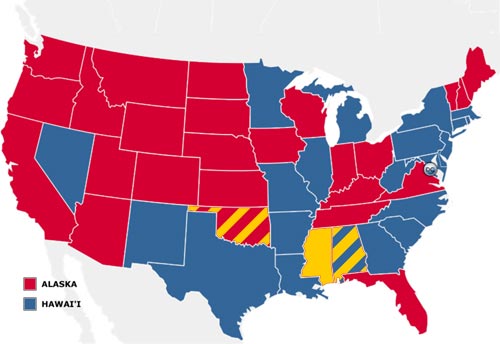
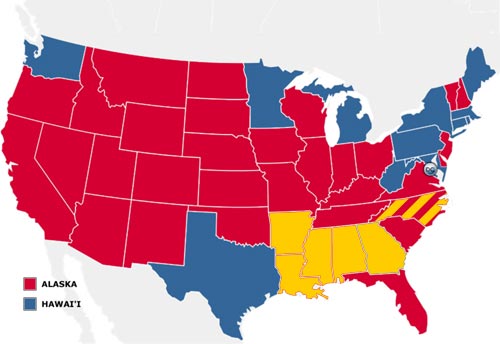
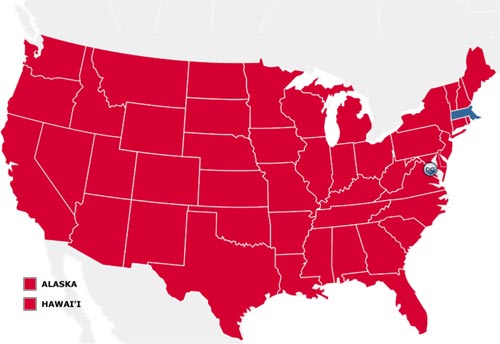
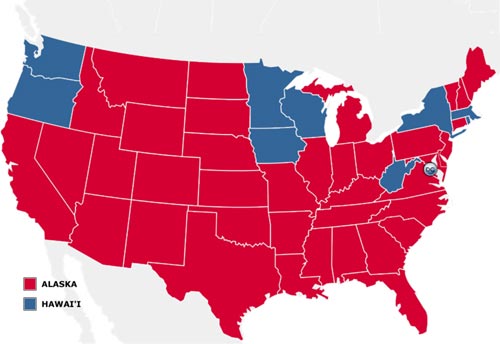
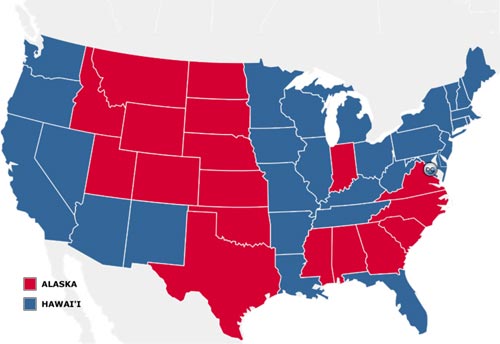
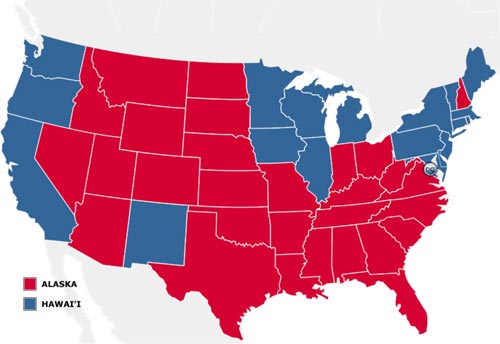
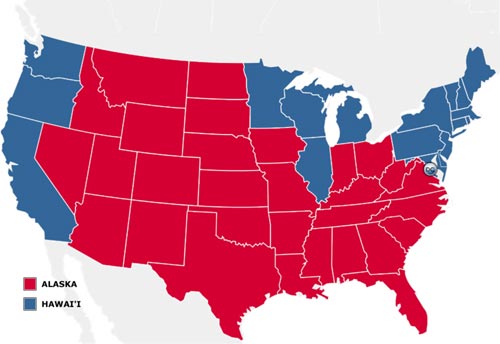
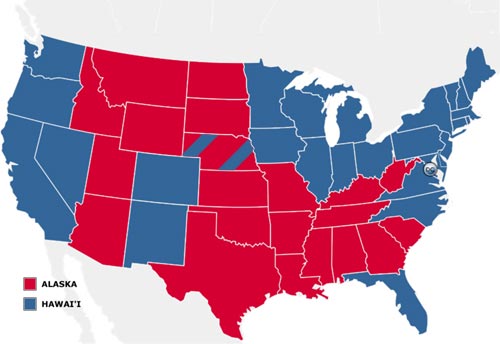
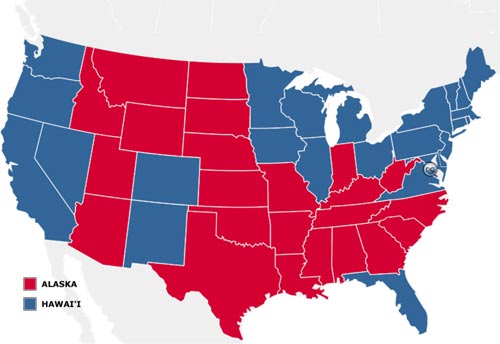
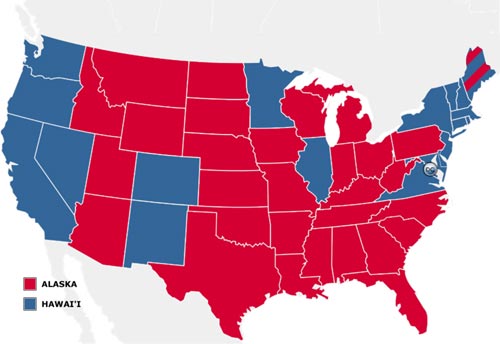
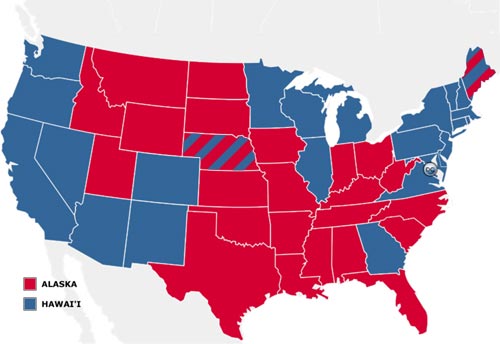
1992 Electoral Coverage 1992 Electoral Map
1996 - Arizona
(D) +110,238 | (R) +49,987
D: 653,288
R: 622,073
B.Clinton (D) vs Dole (R)
1996 Pop: 4,432,000 (Diff: 565,000)
D+R Votes: 1,275,361 (28.8% of Pop)
Margin of Victory: +31,215
D: 51.2% | R: 48.8%
EC Votes (ECVs): 8
3.0% of 270 ECVs needed to win.
1.5% of 538 overall available ECVs.
1996 Electoral Coverage 1996 Electoral Map
2000 - Arizona
(D) +32,053 | (R) +159,579
D: 685,341
R: 781,652
Gore (D) vs W.Bush (R)
2000 Pop: 4,883,000 (Diff: 451,000)
D+R Votes: 1,466,993 (30.0% of Pop)
Margin of Victory: +96,311
D: 46.7% | R: 53.3%
EC Votes (ECVs): 8
3.0% of 270 ECVs needed to win.
1.5% of 538 overall available ECVs.
2000 Electoral Coverage 2000 Electoral Map
2004 - Arizona
(D) +208,183 | (R) +322,642
D: 893,524
R: 1,104,294
Kerry (D) vs W.Bush (R)
2004 Pop: 5,759,000 (Diff: 876,000)
D+R Votes: 1,997,818 (34.7% of Pop)
Margin of Victory: +210,770
D: 44.7% | R: 55.3%
EC Votes (ECVs): 10
3.7% of 270 ECVs needed to win.
1.9% of 538 overall available ECVs.
2004 Electoral Coverage 2004 Electoral Map
2008 - Arizona
(D) +141,183 | (R) +125,817
D: 1,034,707
R: 1,230,111
Obama (D) vs McCain (R)
2008 Pop: 6,499,000 (Diff: 740,000)
D+R Votes: 2,264,818 (34.8% of Pop)
Margin of Victory: +195,404
D: 45.7% | R: 54.3%
EC Votes (ECVs): 10
3.7% of 270 ECVs needed to win.
1.9% of 538 overall available ECVs.
2008 Electoral Coverage 2008 Electoral Map
2012 - Arizona
(D) -9,475 | (R) +3,543
D: 1,025,232
R: 1,233,654
Obama (D) vs Romney (R)
2012 Pop: 6,556,344 (Diff: 57,344)
D+R Votes: 2,258,886 (34.5% of Pop)
Margin of Victory: +208,422
D: 45.4% | R: 54.6%
EC Votes (ECVs): 11
4.1% of 270 ECVs needed to win.
2.0% of 538 overall available ECVs.
2012 Electoral Coverage 2012 Electoral Map
2016 - Arizona
(D) +135,935 | (R) +18,747
D: 1,161,167
R: 1,252,401
H.Clinton (D) vs Trump (R)
2016 Pop: 6,944,767 (Diff: 388,423)
D+R Votes: 2,413,568 (34.8% of Pop)
Margin of Victory: +91,234
D: 48.1% | R: 51.9%
EC Votes (ECVs): 11
4.1% of 270 ECVs needed to win.
2.0% of 538 overall available ECVs.
2016 Electoral Coverage 2016 Electoral Map
2020 - Arizona
(D) +510,976 | (R) +409,285
D: 1,672,143
R: 1,661,686
Biden (D) vs Trump (R)
2020 Pop: 7,421,401 (Diff: 476,634)
D+R Votes: 3,333,829 (44.9% of Pop)
Margin of Victory: +10,457
D: 50.2% | R: 49.8%
EC Votes (ECVs): 11
4.1% of 270 ECVs needed to win.
2.0% of 538 overall available ECVs.
2020 Electoral Coverage 2020 Electoral Map


NOTES:
1) 3rd Party votes / victories are not taken into account as the sole focus of this site is on the Democratic and Republican parties.
2) Pop = Population; These figures are derived from publicly available census figures.
3) D = Democrat/Democratic; R = Republican.
4) D+R Votes = total number of Democratic and Republican votes cast in the presidential election for that year.
5) EC = Electoral College; ECVs = Electoral College Votes.
Site Disclaimer  |  Privacy Policy  |  Cookies

2024 Projection Interactive Electoral Map Electoral Voting Data by State Year-Over-year Party Trends Candidate Favorability Index Joe Biden Quotes Joe Biden Approval Today Inflation Tracker
©2024 www.AmericanPresidents.net • Content ©2019-2024 AmericanPresidents.net • All Rights Reserved. The AmericanPresidents.net logo, its written content, and derived statistical values are unique to this website (unless where indicated) and is protected by all applicable domestic and international intellectual property laws. This resource uses publically-released information. No endorsement of this site by any political group or party should be implied. Information found across this site, verified through publicly available sources, is assumed to be accurate at the time of publication. Material presented throughout this website is for historical and entertainment value only. No A.I. was used in the generation of this content.

©2024 www.AmericanPresidents.net • All Rights Reserved • Content ©2019-2024 (5yrs)