☰
MENU
MENU
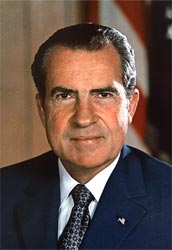 Richard Nixon
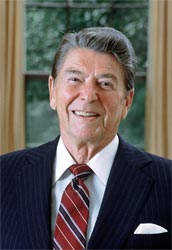 Ronald Reagan
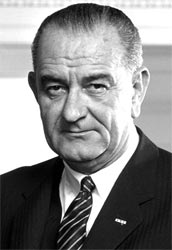 Lyndon Johnson
Ronald Reagan
Lyndon Johnson
Ronald Reagan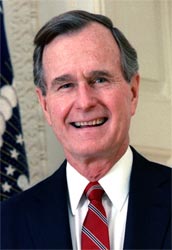 George H.W. Bush
 Donald Trump
 George W. Bush
 Barack Obama
 Bill Clinton
George W. Bush
Richard Nixon
Barack Obama
Donald Trump
Bill Clinton
Bill Clinton
George W. Bush
Richard Nixon
Barack Obama
Donald Trump Joe Biden
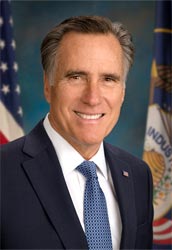 Mitt Romney
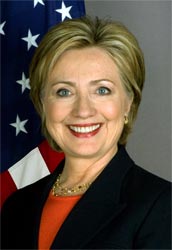 Hillary Clinton
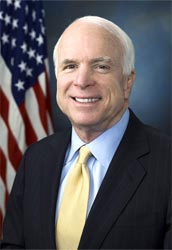 John McCain
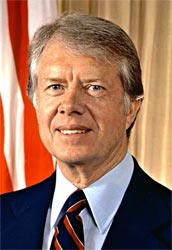 Jimmy Carter
 Al Gore
Richard Nixon
Al Gore
Richard Nixon Gerald Ford
 John Kerry
 Bob Dole
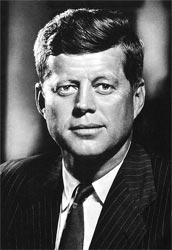 John F. Kennedy
George H.W. Bush
John F. Kennedy
George H.W. Bush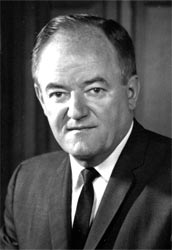 Hubert Humphrey
 Michael Dukakis
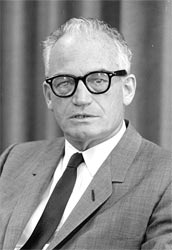 Barry Goldwater
Jimmy Carter
Barry Goldwater
Jimmy Carter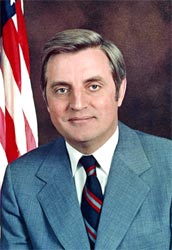 Walter Mondale
 George McGovern