×
2024 Election Projection Interactive Electoral Map Joe Biden Quotes Voting Trends by State Candidate Favorability Index Inflation Calculator 2024

2024 Presidential Election


A by-the-numbers approach determining the winner of the 2024 U.S. Presidential Election

'What matters is this: Biden is going to run and he's going to win. The exact date he 'officially' announces is utterly meaningless' - Rep.Brendan Boyle (D-PA)

With these results online since 12/22/2020, the AmericanPresidents.net experimental 2024 forecast predicts, to the final popular vote being cast, the results of the upcoming U.S. Presidential Election. The projection does not take into account who the actual Republican and Democrat candidates will be, instead attempting to define the winner based purely on voter patterns by state recorded over the last three Presidential Election cycles (2012, 2016, 2020).

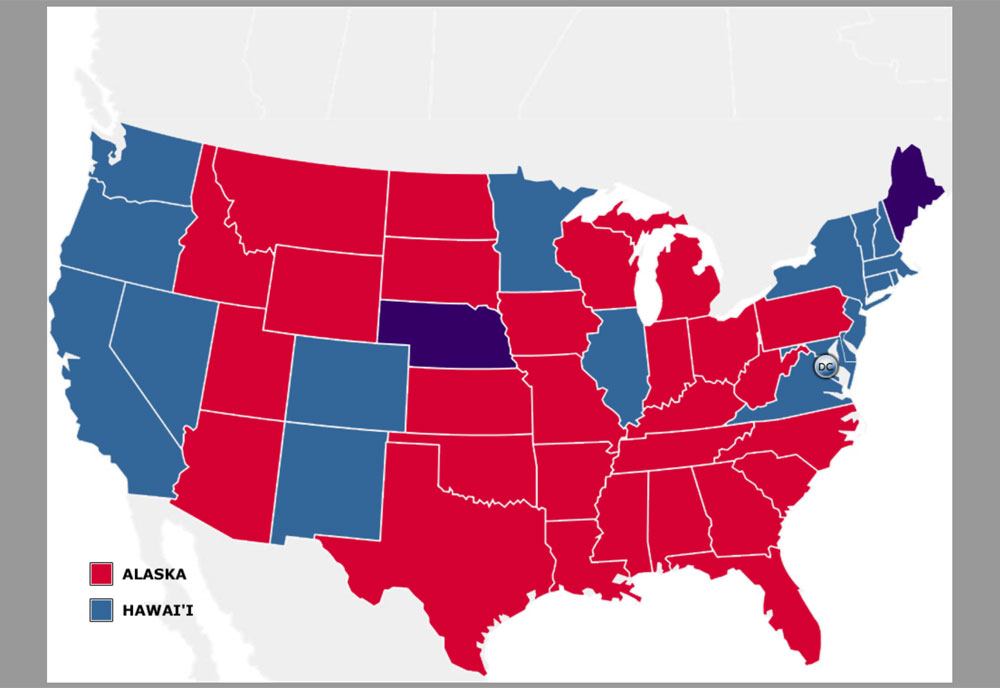
According to the resulting data, key races to watch will be the usual suspects in Arizona (R, +43,466), Maine (D, +16,216), Michigan (R, +27,268), Nevada (D, +16,491), New Hampshire (D, +29,032), North Carolina (R, +145,103), Pennsylvania (R, +56,898), and Wisconsin (R, +64,976) with a combined difference of 541,292 votes making up 95 total Electoral Votes (EVs). The Republicans appear to take back Arizona and Georgia while Biden's 2020 victories in Pennsylvania, Michigan, and Wisconsin will all be reversed. The 'Purple Prizes' in the 2024 election will be Georgia (16ev), Michigan (15ev), North Carolina (16ev), and Pennsylvania (19ev) accounting for a total of 66 EVs - we forecast all of these states going to the Republican candidate.

Our results forecast a Republican White House victory with EV numbers close to that of the Democrats in November 2020. Democrats will, once again, claim the Popular Vote though by a smaller margin than in 2020. The Republicans will claim more overall states and, thusly, more of the EV total.

By our count, Swing States will continue to provide the needed 'swing' to the victor with close races across the lot - Arizona, Georgia, Michigan, Pennsylvania, and Wisconsin. Of note is that these results are strictly a by-the-numbers approach without knowing who the candidates for either side will be or what voter psychology will be heading into the 2024 election season.

Republican Margin of Victory in Key States (Note that these are all previous Trump (2016) AND Biden (2020) victories):
Arizona = +43,466 votes
Georgia = +114,652 votes
Michigan = +154,188 votes
Pennsylvania = +56,898 votes
Wisconsin = +20,682 votes
--- TOTAL: +307,260 ---

Takeaways: The Republicans claim key states narrowingly lost by Trump in 2020 with slightly wider margins of victory, particularly in Arizona, Georgia, and Wisconsin. Using these totals, the race will be called by a margin of just 307,260 votes leaning Republican by a slightly wider margin of victory than what the Biden Campaign saw in 2020 (with a margin of 277,661 votes).
Winner's ribbon image graphic

Candidate #1 (TBA)
Republican

Occupation: TBA
Running Mate: TBA
Carried Home State (TBA): TBA
Incumbent Status: TBA
Favorability Index: 263.2
306
Electoral Votes (270 needed to win)
30 of 50 states carried (60.0%)


71,077,780
Popular Vote (48.7%)
232
Electoral Votes (270 needed to win)
20(+D.C.) of 50 states carried (40.0%)


74,925,915
Popular Vote (51.3%)

Candidate #2 (TBA)
Democrat

Occupation: TBA
Running Mate: TBA
Carried Home State (TBA): TBA
Incumbent Status: TBA
Favorability Index: 180.4


AVAILABLE ELECTORAL COLLEGE VOTES (538 TOTAL):
1) Maine and Nebraska are the only two states that do not follow the 'winner-take-all' rule regarding their Electoral Votes per candidate. This allows for a more proportional division of the claimed Electoral Votes.
2) Projections below are based on trends observed in each state from the 2008, 2016, and 2020 presidential election cycles.
3) It is assumed thata national event such as COVID-19 is no longer in play, accounting for lower turnout in most states (less focus on mail-in voting, absentee ballots, early voting).
4) Electoral vote values below have been adjusted to coincide with the 2020 census results: Democrats lose in California (-1), New York (-1), Illinois (-1), Michigan (-1), and Pennsylvania (-1) but gain in Colorado (+1) and Oregon (+1). Republicans gain in Texas (+2), Florida (+1), and Montana (+1) but lose in Ohio (-1) and West Virginia (-1). Swing State North Carolina gains (+1).


Image of the projected 2024 Electoral Map
307
231
Alabama (9)
Projected: (D) 804,435 | 1,395,893 (R)
2020: (D) 849,624 | 1,441,170 (R)
Alaska (3)
Projected: (D) 140,621 | 171,771 (R)
2020: (D) 153,778 | 189,951 (R)
Arizona (11)
Projected: (D) 1,490,816 | 1,534,282 (R)
2020: (D) 1,672,143 | 1,661,686 (R)
Arkansas (6)
Projected: (D) 399,982 | 738,802 (R)
2020: (D) 423,932 | 760,647 (R)
California (54)
Projected: (D) 10,171,788 | 5,454,209 (R)
2020: (D) 11,110,250 | 6,006,429 (R)
Colorado (10)
Projected: (D) 1,654,004 | 1,354,447 (R)
2020: (D) 1,804,352 | 1,364,607 (R)
Connecticut (7)
Projected: (D) 1,043,207 | 761,381 (R)
2020: (D) 1,080,860 | 715,291 (R)
Delaware (3)
Projected: (D) 271,225 | 200,344 (R)
2020: (D) 296,268 | 200,603 (R)
Florida (30)
Projected: (D) 5,029,553 | 5,346,123 (R)
2020: (D) 5,297,045 | 5,668,731 (R)
Georgia (16)
Projected: (D) 2,242,572 | 2,357,224 (R)
2020: (D) 2,474,507 | 2,461,837 (R)
Hawaii (4)
Projected: (D) 327,672 | 173,316 (R)
2020: (D) 366,130 | 196,864 (R)
Idaho (4)
Projected: (D) 245,659 | 512,797 (R)
2020: (D) 287,031 | 554,119 (R)
Illinois (19)
Projected: (D) 3,243,945 | 2,383,952 (R)
2020: (D) 3,471,915 | 2,446,891 (R)
Indiana (11)
Projected: (D) 1,100,557 | 1,695,448 (R)
2020: (D) 1,242,413 | 1,729,516 (R)
Iowa (6)
Projected: (D) 721,479 | 881,840 (R)
2020: (D) 759,061 | 897,672 (R)
Kansas (6)
Projected: (D) 494,448 | 737,811 (R)
2020: (D) 551,144 | 752,903 (R)
Kentucky (8)
Projected: (D) 772,560 | 1,239,825 (R)
2020: (D) 772,474 | 1,326,646 (R)
Louisiana (8)
Projected: (D) 838,669 | 1,232,182 (R)
2020: (D) 856,034 | 1,255,776 (R)
Maine (3)*
Projected: (D) 410,959 | 394,743 (R)
2020: (D) 434,966 | 360,480 (R)
Maine (1)*
Projected: (D) 410,959 | 394,743 (R)
2020: (D) 434,966 | 360,480 (R)
Maryland (10)
Projected: (D) 1,896,684 | 971,434 (R)
2020: (D) 1,985,023 | 976,414 (R)
Massachusetts (11)
Projected: (D) 2,254,564 | 1,211,518 (R)
2020: (D) 2,382,202 | 1,167,202 (R)
Michigan (15)
Projected: (D) 2,523,684 | 2,550,952 (R)
2020: (D) 2,804,040 | 2,649,852 (R)
Minnesota (10)
Projected: (D) 1,589,351 | 1,447,509 (R)
2020: (D) 1,717,077 | 1,484,065 (R)
Mississippi (6)
Projected: (D) 523,214 | 734,320 (R)
2020: (D) 539,508 | 756,789 (R)
Missouri (10)
Projected: (D) 1,119,040 | 1,690,157 (R)
2020: (D) 1,252,902 | 1,718,282 (R)
Montana (4)
Projected: (D) 212,283 | 330,200 (R)
2020: (D) 244,786 | 343,602 (R)
Nebraska (4)*
Projected: (D) 333,180 | 544,873 (R)
2020: (D) 374,583 | 556,846 (R)
Nebraska (1)*
Projected: (D) 333,180 | 544,873 (R)
2020: (D) 374,583 | 556,846 (R)
Nevada (6)
Projected: (D) 649,320 | 632,829 (R)
2020: (D) 703,486 | 669,890 (R)
New Hampshire (4)
Projected: (D) 393,454 | 364,422 (R)
2020: (D) 424,937 | 365,660 (R)
New Jersey (14)
Projected: (D) 2,424,847 | 1,744,295 (R)
2020: (D) 2,608,327 | 1,883,260 (R)
New Mexico (5)
Projected: (D) 443,885 | 370,711 (R)
2020: (D) 501,614 | 401,894 (R)
New York (28)
Projected: (D) 4,807,196 | 3,121,157 (R)
2020: (D) 5,244,006 | 3,251,230 (R)
North Carolina (16)
Projected: (D) 2,530,072 | 2,675,175 (R)
2020: (D) 2,684,292 | 2,758,775 (R)
North Dakota (3)
Projected: (D) 102,565 | 235,616 (R)
2020: (D) 114,902 | 235,595 (R)
Ohio (17)
Projected: (D) 2,545,812 | 3,045,671 (R)
2020: (D) 2,679,165 | 3,154,834 (R)
Oklahoma (7)
Projected: (D) 455,739 | 974,281 (R)
2020: (D) 503,890 | 1,020,280 (R)
Oregon (8)
Projected: (D) 1,202,616 | 907,740 (R)
2020: (D) 1,340,383 | 958,448 (R)
Pennsylvania (19)
Projected: (D) 3,190,219 | 3,247,117 (R)
2020: (D) 3,459,923 | 3,378,263 (R)
Rhode Island (4)
Projected: (D) 283,701 | 190,566 (R)
2020: (D) 307,486 | 199,922 (R)
South Carolina (9)
Projected: (D) 1,014,413 | 1,320,351 (R)
2020: (D) 1,091,541 | 1,385,103 (R)
South Dakota (3)
Projected: (D) 129,259 | 252,551 (R)
2020: (D) 150,471 | 261,043 (R)
Tennessee (11)
Projected: (D) 1,008,385 | 1,739,087 (R)
2020: (D) 1,143,711 | 1,852,475 (R)
Texas (40)
Projected: (D) 4,696,991 | 5,546,965 (R)
2020: (D) 5,259,126 | 5,890,347 (R)
Utah (6)
Projected: (D) 446,242 | 802,245 (R)
2020: (D) 560,282 | 865,140 (R)
Vermont (3)
Projected: (D) 214,247 | 105,317 (R)
2020: (D) 242,820 | 112,704 (R)
Virginia (13)
Projected: (D) 2,269,355 | 1,934,884 (R)
2020: (D) 2,413,568 | 1,962,430 (R)
Washington (12)
Projected: (D) 2,159,355 | 1,486,976 (R)
2020: (D) 2,369,612 | 1,584,651 (R)
West Virginia (4)
Projected: (D) 198,794 | 533,039 (R)
2020: (D) 235,984 | 545,382 (R)
Wisconsin (10)
Projected: (D) 1,527,282 | 1,592,258 (R)
2020: (D) 1,630,866 | 1,610,184 (R)
Wyoming (3)
Projected: (D) 63,020 | 189,285 (R)
2020: (D) 73,491 | 193,559 (R)
Dictrict of Colombia (3)
Projected: (D) 313,000 | 17,884 (R)
2020: (D) 317,323 | 18,586 (R)
Site Disclaimer  |  Privacy Policy  |  Cookies

2024 Projection Interactive Electoral Map Electoral Voting Data by State Year-Over-year Party Trends Candidate Favorability Index Joe Biden Quotes Joe Biden Approval Today Inflation Tracker
©2024 www.AmericanPresidents.net • Content ©2019-2024 AmericanPresidents.net • All Rights Reserved. The AmericanPresidents.net logo, its written content, and derived statistical values are unique to this website (unless where indicated) and is protected by all applicable domestic and international intellectual property laws. This resource uses publically-released information. No endorsement of this site by any political group or party should be implied. Information found across this site, verified through publicly available sources, is assumed to be accurate at the time of publication. Material presented throughout this website is for historical and entertainment value only. No A.I. was used in the generation of this content.

©2024 www.AmericanPresidents.net • All Rights Reserved • Content ©2019-2024 (5yrs)